Vmalert: Revamp your Prometheus alert with microservices
Vmalert: the prometheus alerting microservice
While collecting metrics is important for monitoring, the real end goal is not visualizing the data. The most critical goal of metrics is to create alerts in case of bad behaviors or incidents. In the Prometheus world, prometheus itself generates alerts based on the metrics collected.
Let’s discover another product of VictoriaMetrics called Vmalert. To be honest, Vmalert is not a revolutionary product, exactly like Vmagent, but its strength is the ability to do 1 role: handling alerts with the minimum resources.
The problem
While prometheus is an awesome product, it has 1 default. It’s not scalable. If you have used monitoring in prod, you know that the number of metrics is always increasing. Ok, but what is the problem? The problem is that more metrics means more resources, which is not unlimited. While you cannot create replicas of prometheus to split the load, it’s always better to use prometheus for 1 task: metrics database.
The solution
Moving the alerts handling to a separate outsider microservice, it’s a better solution IMHO. You can reduce the load on prometheus, but also you can switch the prometheus datasource easily, or use multiple prometheus as datasource for your alerts.
Like vmagent, [Vmalert] is lightweight microservice that has 1 job: handling alerts and sending them to alertmanagers.
How to deploy it
let’s configure a vmalert connected to a victoriametrics server. You can do the same with prometheus.
# docker-compose.yml
version: "3.5"

services:
  vmalert:
    container_name: vmalert
    image: victoriametrics/vmalert:v1.93.4
    depends_on:
      - "victoriametrics"
      - "alertmanager"
    ports:
      - 8880:8880
    volumes:
      - ./alerts.yml:/etc/alerts/alerts.yml
    command:
      - "--datasource.url=http://victoriametrics:8428/" # Read the metrics
      - "--remoteRead.url=http://victoriametrics:8428/" # Read the alerts saved
      - "--remoteWrite.url=http://victoriametrics:8428/" # Write the alerts state
      - "--notifier.url=http://alertmanager:9093/"
      - "--rule=/etc/alerts/*.yml"
      # display source of alerts in grafana
      - "--external.url=http://127.0.0.1:3000" #grafana outside container
    restart: always

  victoriametrics:
    container_name: victoriametrics
    image: victoriametrics/victoria-metrics
    ports:
      - 8428:8428
    command:
      - "--httpListenAddr=:8428"

  alertmanager:
    container_name: alertmanager
    image: prom/alertmanager:v0.25.0
    volumes:
      - ./alertmanager.yml:/config/alertmanager.yml
    command:
      - "--config.file=/config/alertmanager.yml"
    ports:
      - 9093:9093
    restart: always
Config files
Exactly like prometheus and alertmanager, Vmalert and alertmanager needs both a configuration file at least to work. Note that vmalert understands perfectly the prometheus alerting synthax, but also has more features that you can check in their docs.
In the same directory as docker-compose.yml, create the 2 following files.
alert.yml
# alert.yml

# File contains default list of alerts for VictoriaMetrics single server.
# The alerts below are just recommendations and may require some updates
# and threshold calibration according to every specific setup.
groups:
  # Alerts group for VM single assumes that Grafana dashboard
  # https://grafana.com/grafana/dashboards/10229 is installed.
  # Pls update the `dashboard` annotation according to your setup.
  - name: testAlerts
    interval: 30s
    concurrency: 2
    rules:
      - alert: DiskRunsOutOfSpaceIn3Days
        expr: up == 0
        for: 5m
        labels:
          severity: critical
        annotations:
          dashboard: "http://localhost:3000/d/wNf0q_kZk?viewPanel=73&var-instance={{ $labels.instance }}" # This is a fake link
          summary: "Instance {{ $labels.instance }} is down"
          description: "Instance is down, please check it"
alertmanager.yml
# alertmanager.yml

route:
  receiver: blackhole

receivers:
  - name: blackhole
Stop wasting your time !
Each holiday, you decide to make a smart home project. But each holiday, you spend hours on finding an interesting project to do.
Don't worry, I can help you ! Join my community to receive the newest DIY projects periodically.
Promise! No spam, your email is kept private
Run the stack
Run the following command
$ docker compose up -d
Test
After the stack is up and running, go to vmalert at http://localhost:8880. Vmalert offers a basic UI that list the alerts occuring and the different information about the alert.
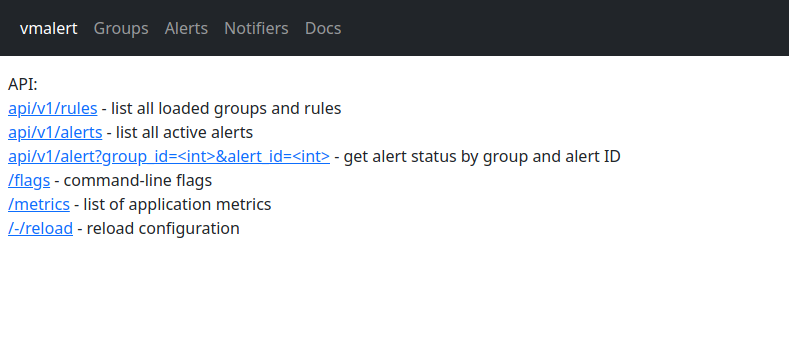
Once you have an alert in vmalert UI (or API), you can also check that alertmanager http://localhost:9093 has received this alert as well.
Conclusion
Arrivng to the conclustion of this article, if the alerting configuration is the same, so why not using more lightweight microservices? It’s been 3 years that I’m working with VictoriaMetrics components, and i can confirm how resilient and robust they are honestly.
If you need my help, feel free to contact me for a short or long term contract.
Don’t hesitate to leave a comment if you got any problem, or say simply a thanks for the tutorials.