victoriametrics
victoriametrics
How We Cut Our Prometheus / VictoriaMetrics Storage Bill by 60% (Cardinality Audit Walkthrough)
The bill that made me open a support ticket with myself Last October our VictoriaMetrics cluster crossed 340 million active time series and our monthly infra cost for the storage tier hit $4,900. Nobody had approved that number. It just… grew, the way disk usage always grows, one Helm chart install at a time until finance asks why the “monitoring” line item is bigger than the “database” line item. I spent the better part of a week doing a cardinality audit on that cluster.
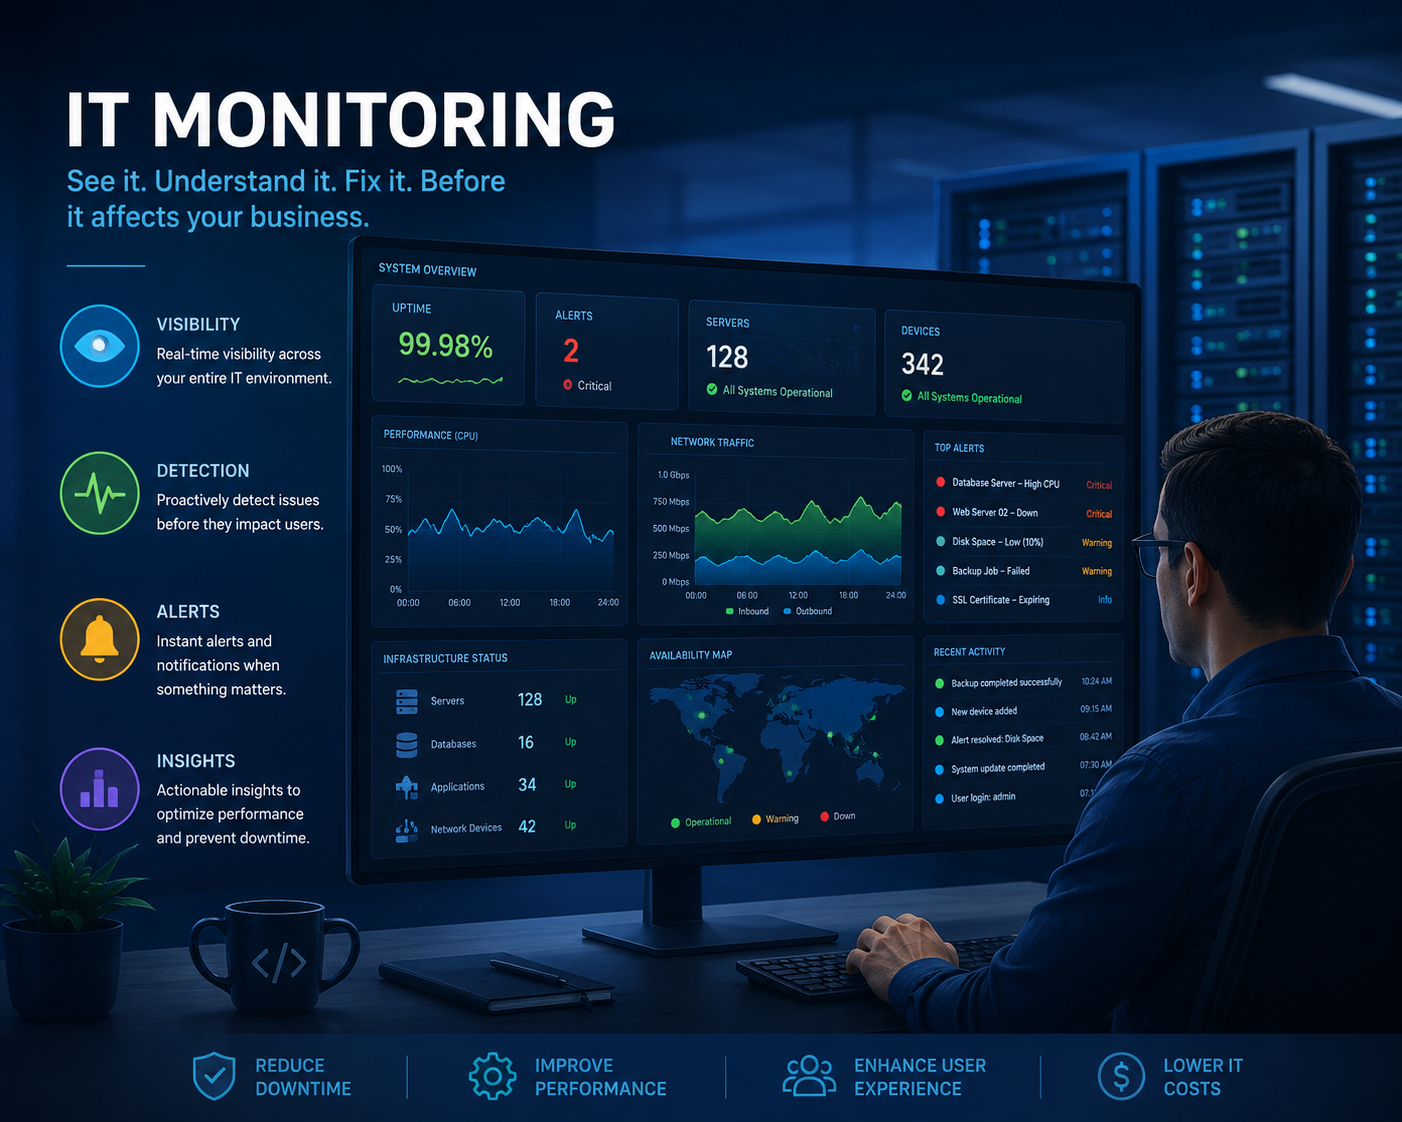
How to Build Your Infrastructure Monitoring in 2026
Every year I get asked the same question by teams starting from scratch: “we have Grafana, we have some dashboards, why do we still get paged for things we didn’t see coming?” Most of the time, the answer isn’t a missing tool. It’s a missing method. Teams jump straight to “let’s install Prometheus” or “let’s buy a SaaS observability platform” before answering a much simpler question: what does “healthy” actually mean for this business?
How to Set Up Prometheus Remote Write to Push Metrics to VictoriaMetrics
I’ve been running my own monitoring stack for years, and if there’s one thing I’ve learned, it’s that Prometheus alone can feel like trying to store all your holiday decorations in a single shoebox. It works fine at first, but soon you’re dealing with capacity issues and wondering where that one crucial metric from three months ago disappeared to. That’s why I recently set up Prometheus remote write to push metrics to VictoriaMetrics for centralized, long-retention storage.
Detect Outliers in Your Metrics: A Practical Guide to Grafana Machine Learning
I’ve always been the kind of person who stares at a Grafana dashboard, watching a squiggly line, and wondering, “Is that dip normal? Should I be worried?” For years, my answer was to set up a basic threshold alert. If CPU usage goes above 90%, page someone. But what about the weird, subtle stuff? The slow creep of memory leakage or the sudden, inexplicable drop in request rate that doesn’t cross any static line but just feels… off?
Prometheus vs VictoriaMetrics: Performance, Storage, and Query Language Compared
I’ve spent years tinkering with monitoring tools—first as a hobbyist automating my smart home, then professionally while scaling observability pipelines. Two names kept popping up: Prometheus (the de facto standard) and VictoriaMetrics (the “faster, cheaper” alternative). But which one should you use? Let’s break it down with real-world benchmarks, storage deep-dives, and query language quirks. Why Compare Prometheus and VictoriaMetrics? Prometheus is the Kubernetes-monitoring darling, but VictoriaMetrics promises better performance with lower resource usage.
Building a Monitoring Stack with Prometheus, VictoriaMetrics, and Grafana: A Full Setup Guide
Ever found yourself drowning in server logs, wondering why your application crashed again at 3 AM? I’ve been there—more times than I’d like to admit. That’s why I built a robust monitoring stack with Prometheus, VictoriaMetrics, and Grafana to keep an eye on my systems. In this guide, I’ll walk you through setting up this powerful trio to collect, store, and visualize metrics at scale—without losing your sanity. Why This Stack?
High-Cardinality Metrics: Detection and Optimization in Prometheus and VictoriaMetrics
I remember the first time my Prometheus instance crashed spectacularly after I added a new exporter. The logs screamed about “out of memory” errors, and my Grafana dashboards turned into ghost towns. After some frantic debugging, I discovered the culprit: high-cardinality metrics. In this guide, I’ll share practical techniques I’ve learned for identifying and optimizing these metric monsters in both Prometheus and VictoriaMetrics. 💡 Pro Tip: High-cardinality metrics are like uninvited guests at a party - they consume all your resources and leave you with a mess to clean up.
Prometheus Anomaly detection: Z-Score in PromQL
Monitoring HTTP request rates is one of the most basic yet essential tasks in observability. A sudden spike might indicate a traffic surge or even a DDoS attack, while a sudden drop could signal a backend failure. Static thresholds work, but they often miss subtle patterns or raise too many false alarms. A better way is to use statistical anomaly detection—specifically Z-score based alerts in Prometheus. In this post, we’ll walk through how to set up a Z-score PromQL alert to detect anomalies in HTTP request rates using only Prometheus and native PromQL.

A Full Guide to Monitoring Strategies for Enterprises
Monitoring, stop being blind! After 3 years working in the monitoring team at the one of the biggest videogames company, I will unveil some secrets and strategies of monitoring for enterprises. These strategies can be applied to small or big companies depending on their context and uses. But what is monitoring? Monitoring is the fact of collecting information about an entity (application, machine, URL…) on a frequent basis. In general, this raw data is passed through visualization apps to give a visibility on the enterprise entities.

Vmalert: Revamp your Prometheus alert with microservices
Vmalert: the prometheus alerting microservice While collecting metrics is important for monitoring, the real end goal is not visualizing the data. The most critical goal of metrics is to create alerts in case of bad behaviors or incidents. In the Prometheus world, prometheus itself generates alerts based on the metrics collected. Let’s discover another product of VictoriaMetrics called Vmalert. To be honest, Vmalert is not a revolutionary product, exactly like Vmagent, but its strength is the ability to do 1 role: handling alerts with the minimum resources.