opentelemetry
opentelemetry
Building a Single-Pane RED Dashboard for Microservices with OpenTelemetry and Semantic Conventions
Three months ago we had 34 microservices and 34 Grafana dashboards, each one hand-built by whoever owned that service at the time. Some had rate/error/duration panels. Some had CPU and memory but no latency. One had a pie chart of HTTP status codes that nobody had looked at in a year. When we had an incident that touched five services at 2am, the on-call engineer had to open five different dashboards, each with different label names (route vs path vs endpoint), different histogram bucket boundaries, and different naming for the same metric.
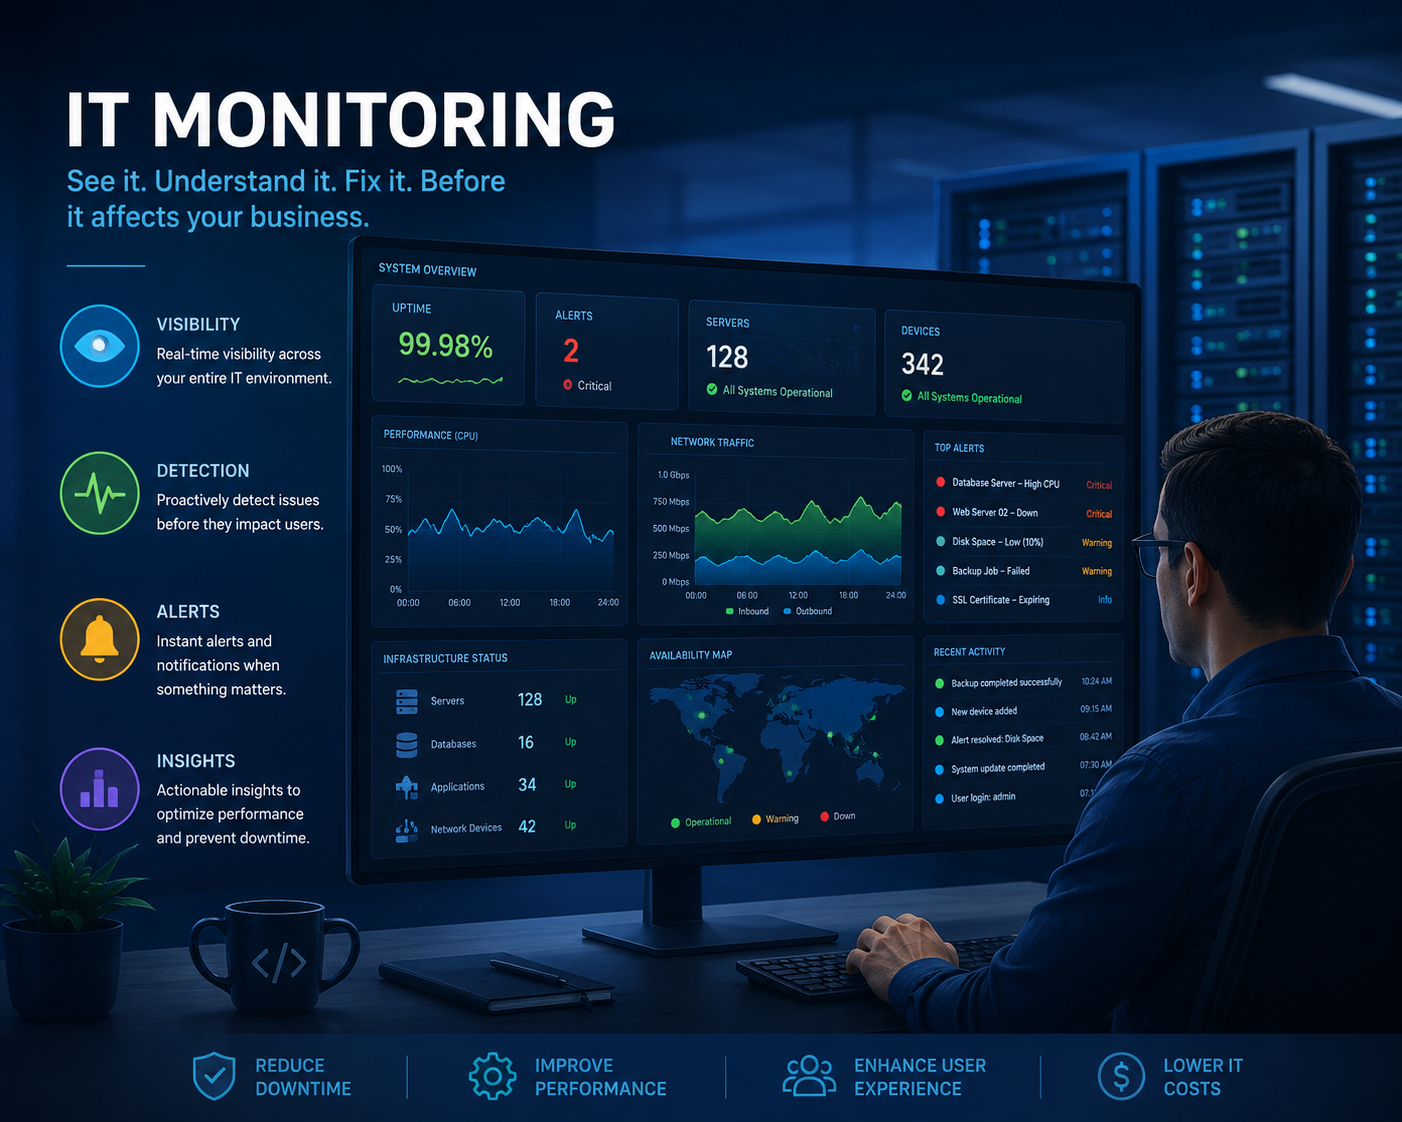
How to Build Your Infrastructure Monitoring in 2026
Every year I get asked the same question by teams starting from scratch: “we have Grafana, we have some dashboards, why do we still get paged for things we didn’t see coming?” Most of the time, the answer isn’t a missing tool. It’s a missing method. Teams jump straight to “let’s install Prometheus” or “let’s buy a SaaS observability platform” before answering a much simpler question: what does “healthy” actually mean for this business?