A Full Guide to Monitoring Strategies for Enterprises
Monitoring, stop being blind!
After 3 years working in the monitoring team at the one of the biggest videogames company, I will unveil some secrets and strategies of monitoring for enterprises. These strategies can be applied to small or big companies depending on their context and uses.
But what is monitoring? Monitoring is the fact of collecting information about an entity (application, machine, URL…) on a frequent basis. In general, this raw data is passed through visualization apps to give a visibility on the enterprise entities. Then, one of the end goals is to create alerts based on this data to detect or anticipate abnormal behaviors.
Setup Monitoring is passing from “blind” to “sighted” state. To be in full sighted state, there is 3 pillars for monitoring: Metrics, Logs and Tracing.
1- Create a monitoring team
Monitoring is considered as a transversal competence that each team should have. However, if each team chooses its own monitoring solution, it’s gonna be a chaos for 3 reasons:
- Maintenance: if the person that was maintaining the monitoring instance left the team, most probably, no one will do. I call it an
orphan instance. - Support: if a team chooses a specific tool used by nobody else, they could be stuck sometimes and will need help.
- Divergence of knowledge: collaboration between teams or internal mobility could be more difficult.
The goal of this team is:
- Providing tools: provide and maintain the monitoring instance all over the time.
- Support: monitoring team is an expert in its domain, it can help all the other teams.
- Converged knowledge: choose a limited number of suitable tools that will be used by all the company.
2- Monitor everything
If you have a service running in production, you should monitor :
- the application (code)
- the network
- the infrastructure
Monitor the application
When coding an application, metrics should be added to all the parts of the projects. I use Prometheus when coding in Golang, but it can be used in many languages. Example of metrics:
- Counters: number of http requests, number of data processed,…
- Timers: the time necessary for a function to execute, …
These metrics will give you an insight of what’s going on your application, how many requests are you receiving, etc… I mean let’s be honest, how can you know if your application needs to be scaled if you don’t know what is the actual status.
Monitor the network
In many cases, your app will behave abnormally because of netowrk issue. Multiple tests can be good to monitor the network issues, example :
- Ping your app from multiple regions and check that it’s up
- Measure the requests time and create an alert when it’s slow.
- Measure the network speed …
I recommend these open source tools :
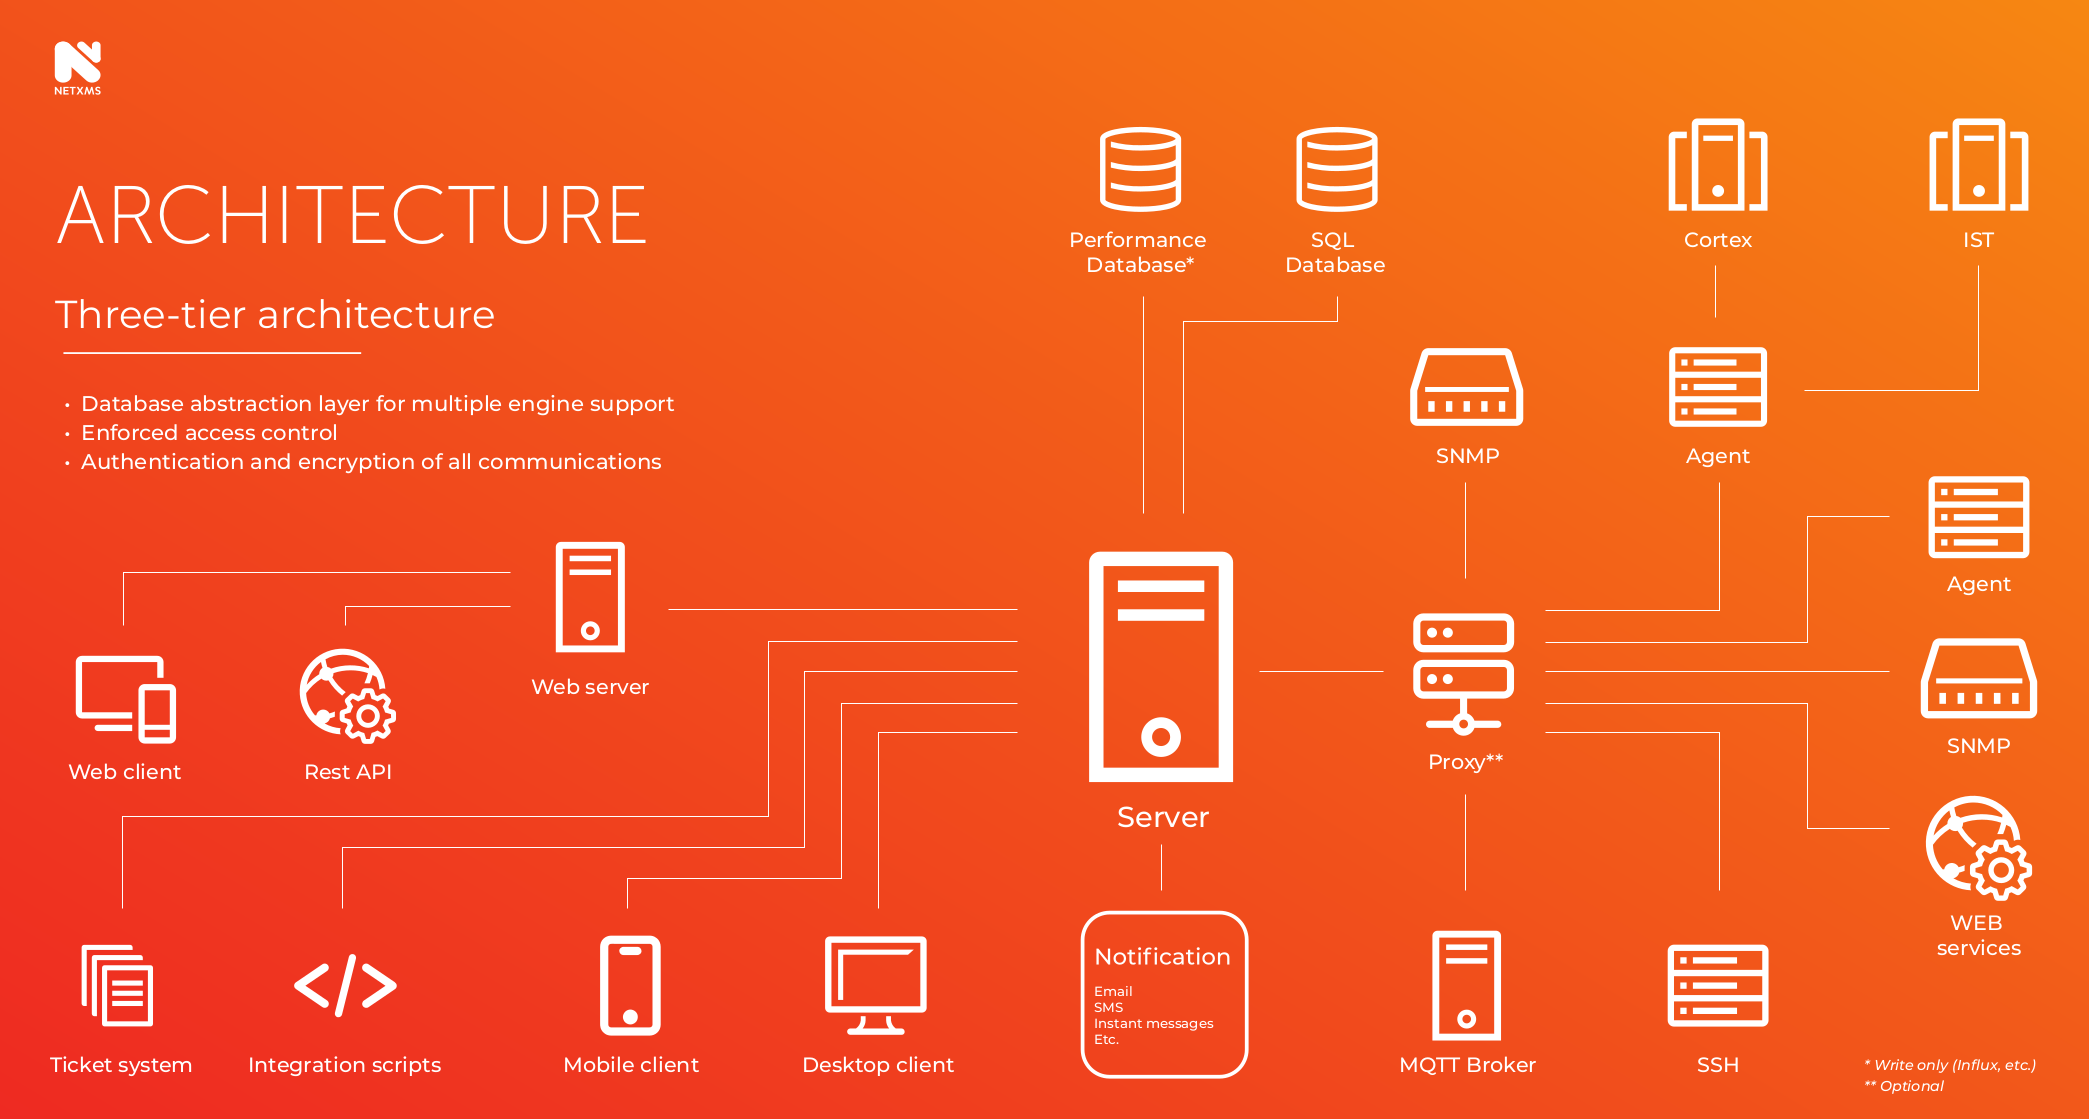
- Netxms: https://github.com/netxms/netxms
- Opennms: https://github.com/OpenNMS/opennms
- Librenms: https://github.com/librenms/librenms
Monitor the infrastructure
If you have the permissions to install tools on the nodes, all the nodes resources and activities should be monitored. One of the most famous tools is prometheus node exporter. It exposes a bunch of very interesting metrics like:
- CPU Load
- Disk available/used
- RAM available/used …
These metrics are priceless ! They will tell you about :
- Resource waste : the number of resources that are allocated to someone but not used.
- Issues detection: nodes unavailability can be rapidly detected.
- Statistics & forecast: knowing the number of used resources and how are the trends, the IT team can know how much resources they will need in the future.
3- Visualize metrics
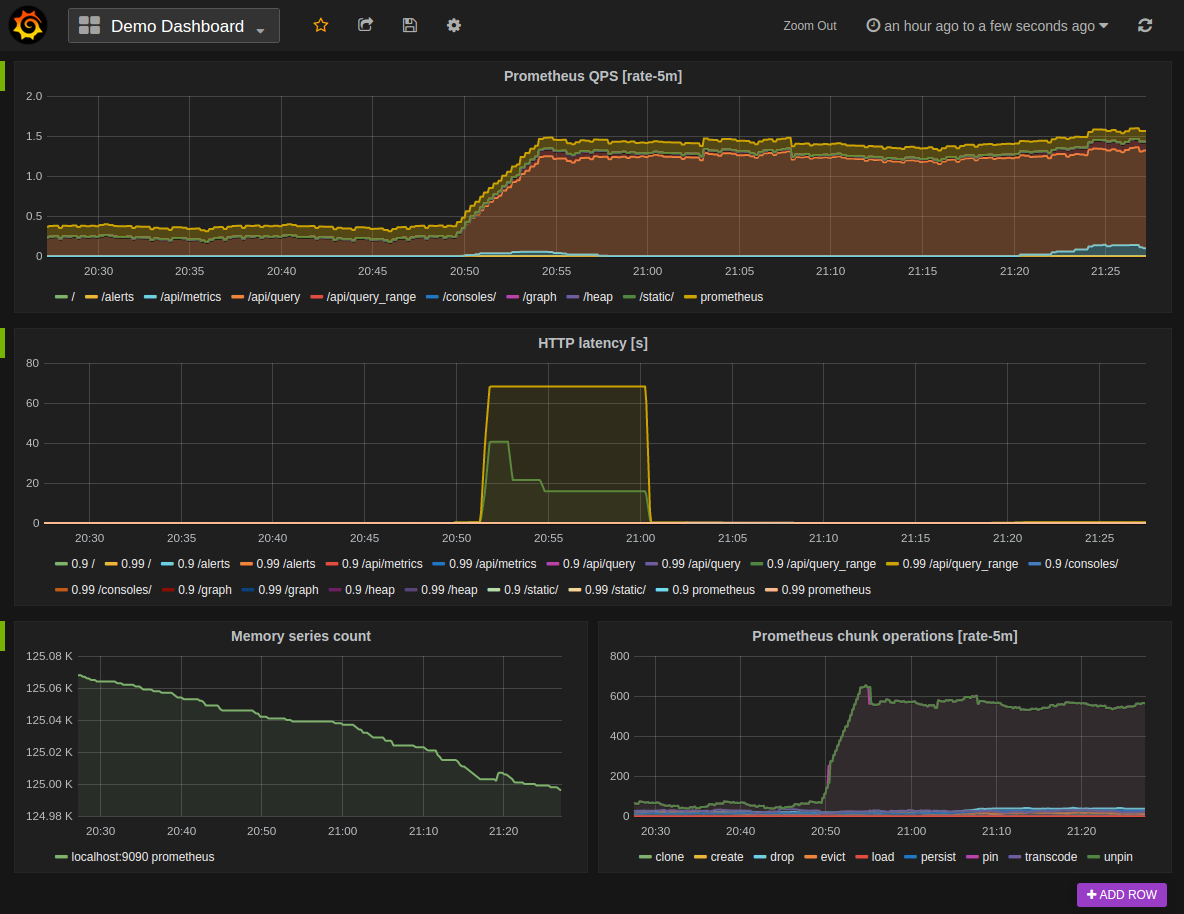
Congratulations, now you have metrics, you are not blind anymore! But what shall you do with them? Look at them simply :) After collecting metrics, you should build dashboards to visualize how your application, network and infrastructure behave. For this, I suggest you Grafana, an open source tool that has a very big community.
Creating dashboards and panels will let you know the current state of your platform. In case of performance issue, it will be very helpful to detect the issue or improvements.
4- Create alerts
When in production, you should define an alert list that will be triggered in case of incident. I use Prometheus that lets you define alerts based on the metrics collected before. Also, you will need Alertmanager, a tool that shows the current firing incidents and sends notifications to multiple receivers ( emails, telegram, slack,…).
While alerts are beautiful, I suggest to not abuse with alerts, but only those who represents a real dysfunction in the application. In addition, Prometheus let you create a severity for the alert. Sometimes, you will have the time to treat all the incidents, use this severity to decide whether to send notifications or not.
Alerts should also being reviewed on a frequent basic to make sure it’s up to date.
5- Logs
Logs are one of the most valuable information you can have on your IT entities. While logs can be seen by tailing the log files, this method does not work at scale. When you have 200 replicas of a microservice, I wish you good luck tailing all those replicas. Hopefully, solutions exists to collect logs and search by using advanced filters. One of the most popular is called ELK Elastic, Logstash, Kibana.
6- Tracing
While metrics are designed to monitor a function or lines of code, Tracing is the fact of measuring the metrics of the user journey through the app. The goal is to detect what’s taking time in the processing and trying to optimize the performance. Grafana Tempo is an amazing tool to store your traces.
7- OnCall - Paging
A service in production is an application that is highly available (HA). That means day and night, weekday or weekend, 24/7 the application should be running without major issues. Remember that time is money. If your application makes $10K an hour and it’s not working for 2 hours, that’s a real problem. You should setup OnCall in your team when you receive alerts. OnCall is a term that represents calling someone or being paged to fix the problems in a short time out of the business hours.
While the OnCall will cost you money, remember that this will save your reputation which is not easy to make it back.
8- Consult Specialists
If you need help to define or to evaluate your monitoring strategy and solutions, don’t be afraid to look for help outside of your company. You can contact me on Linkedin, I will be glad to help you.
Conclusion
I’m confident to say that metrics and logs are the main 2 pillars for monitoring. Without both of them, you are completely blind. If you are building or improving the monitoring of your company, you should focus on those parts first. While tracing is amazing, but a production can live without it easily.
Alerts should be defined and reviewed frequently to not miss any issue and to avoid false alarms. Also, OnCall is a must for a service in production that generates money.
Please leave comments if you have any suggestions, or if you simply like the article.