Grafana 9 Alert : How to customize alert message
Grafana added the alert feature recently and it’s now released with the Grafana 9. That’s a great feature for the people who don’t want to set a proper alermanager and to configure it. I’ve took the time to explore the alert and play with it. Let’s see how it works!
Deploy grafana and prometheus
With the docker-compose file below run the grafana and prometheus docker-compose up -d.
# docker-compose.yml file

version: "3.5"

services:
  prometheus:
    image: quay.io/prometheus/prometheus:latest
    volumes:
      #- ./prometheus.yml:/etc/prometheus/prometheus.yml
      - prometheus:/prometheus
    #command: "--config.file=/etc/prometheus/prometheus.yml --storage.tsdb.path=/prometheus"
    ports:
      - 9090:9090

  grafana:
    image: grafana/grafana:latest
    ports:
      - "3000:3000"
    volumes:
      - grafana-storage:/var/lib/grafana

volumes:
  prometheus:
    name: prometheus
  grafana-storage:
    name: grafana-storage
Build your alert
I have 2 websites running on a raspberrypi. In my case, I would like to know when the website is down and to get notified with the website name.
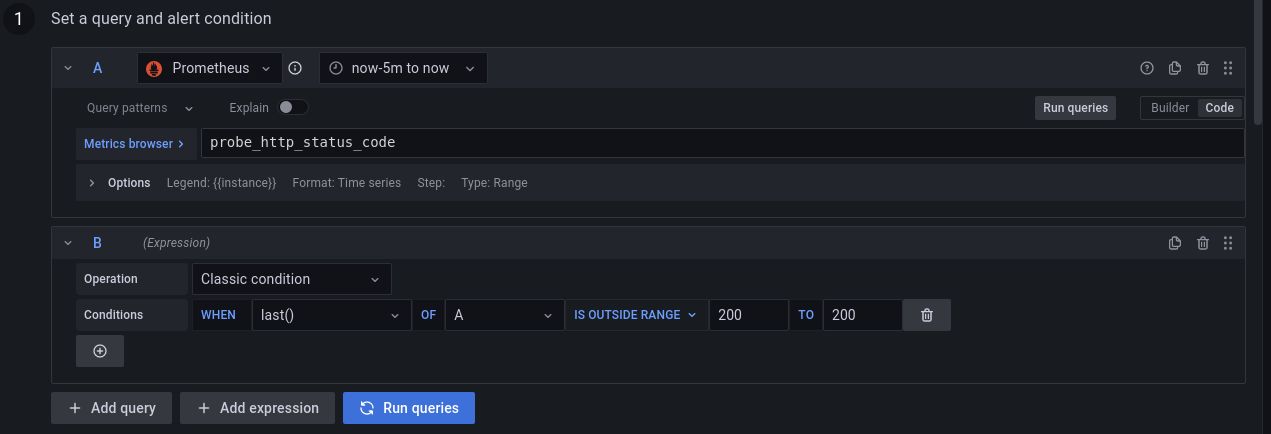
1- Define the alert
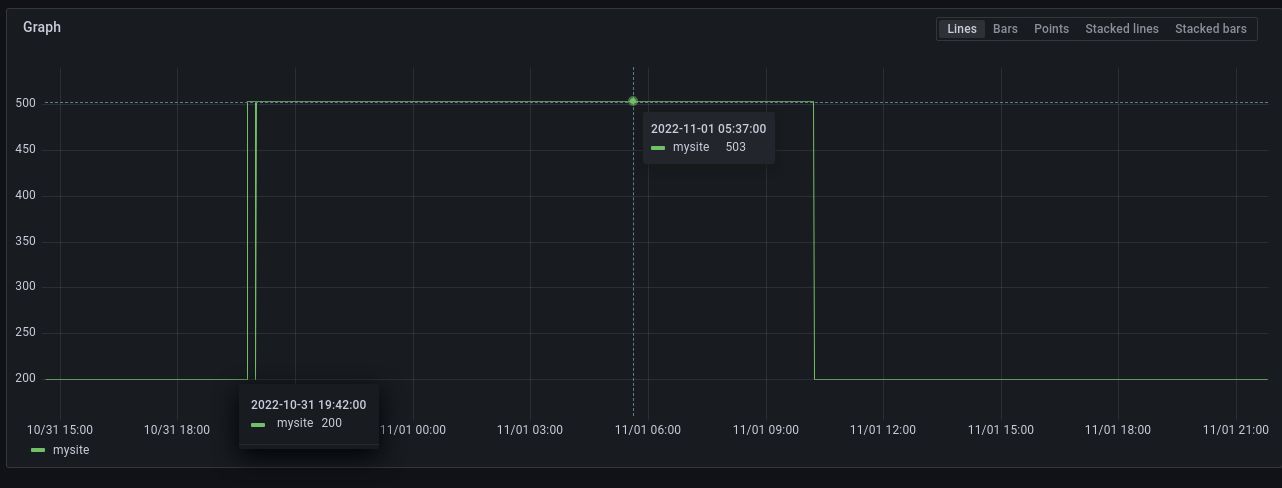
Using a blackbox_exporter, i have the metric probe_http_status_code that returns the status code of querying the website. To make it easy, let’s consider that the status code 200 is only the valid status_code, otherwise FIRE AN ALARM.
If you have a dashboard for this metric:
- Edit the dashboard
- Click on the tab
Alert - Create rule for this panel
- Start creating your alert
If you don’t have a dashboard for this metric:
- In the left bar, click on
Alert rules. - Create a new alert rule
- In the left bar, click on
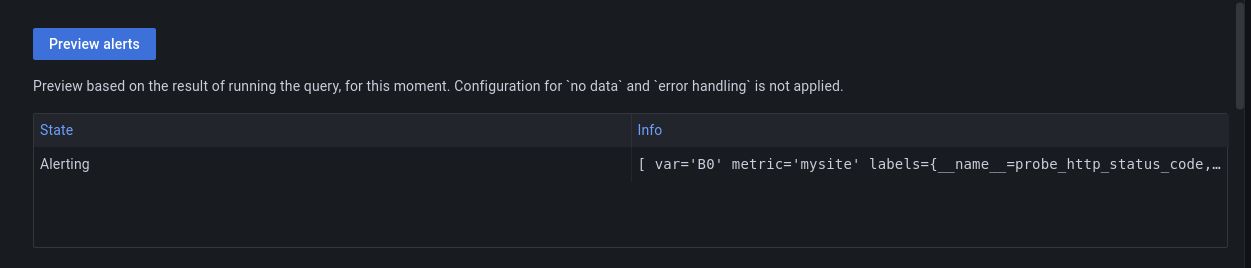
2- Preview the alert
For testing purposes, a website has been turned off to fire an alarm. Click on the button Preview alerts to show the alert labels and value.
3- Build a custom description
Grafana uses Go templates to customize the alerts with the template_data. However, despite my knowledge in go templating, I’ve found this stage not very clear in grafana docs.
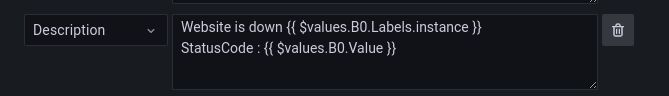
To access the labels of the alert in the description box, you have a root variable called $values. Then, get the var variable from the Preview alerts box. This var is the entrypoint to the labels.
An example of the description could be {{ $values.var.Labels.instance }}, In my case:
{{ $values.B0.Labels.instance }}
Define contact points
Contact points are the means that grafana can send through the alerts to the users.
You have a bunch of choices:
- Telegram
- Webhook
- …
Feel free to define your contact point. If you have any difficulties please let me know in the comment box below.